Logistics dashboard
Objective
This dashboard provides a comprehensive view of the company’s logistics operations, tracking deliveries, costs, and efficiency. It automates data extraction and transformation, ensuring accurate logistics insights.
Scenario
The logistics team manually extracted and processed delivery data, which was time-consuming and prone to errors. The goal was to automate this process and create a dashboard that helps monitor key delivery metrics efficiently.
Workflow
- Data Extraction & Transformation:
- Tableau Prep automates data extraction and transformation.
- Data is cleaned, structured, and enriched for reporting.
- Data Storage:
- Transformed data is stored in a SQL database, creating structured tables for optimized analysis.
- Dashboard & Reporting:
- Tableau is used to build interactive visualizations, providing tracking of logistics KPIs.
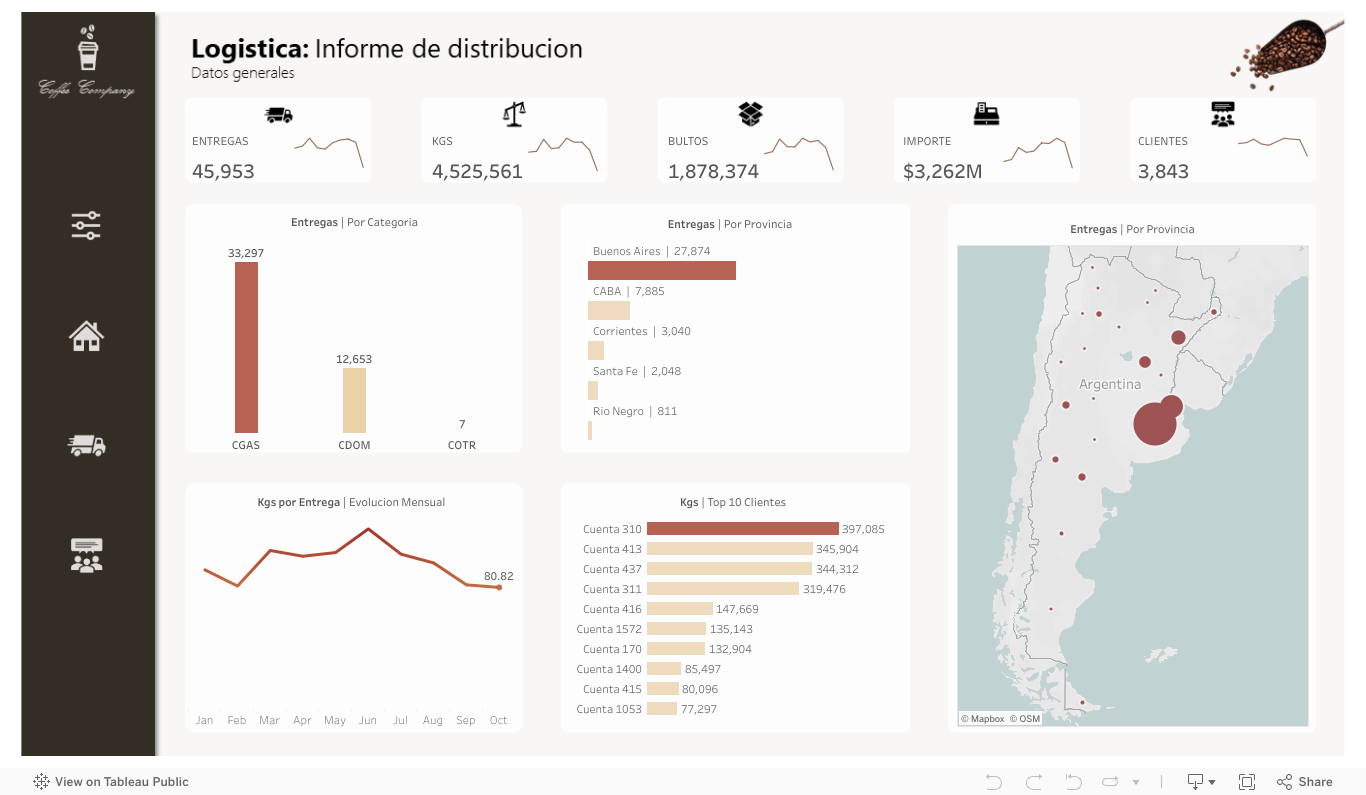
Key Metrics & Visuals
- Entregas realizadas (Completed deliveries).
- KGs entregados (Kilograms delivered).
- KGs por entrega (Kilograms per delivery).
- $ por entrega (Revenue per delivery).
- Bultos entregados (Packages delivered).
- Importe total (Total revenue).
- Cantidad de clientes (Number of customers served).
Technologies Used
- ETL: Tableau Prep.
- Data Storage: SQL Database.
- Reporting & Visualization: Tableau.
Business Impact
- Efficiency Gains: Eliminated manual data extraction and transformation, saving time.
- Data Accuracy: Improved consistency and reduced errors in logistics reporting.
- Better Decision-Making: Enabled faster monitoring of deliveries and costs, optimizing logistics operations.
Challenges & Solutions
- Data Cleaning Complexity: Developed structured transformations in Tableau Prep to handle raw logistics data.